
9 September 2025 — Nicolas Daüy
Installing a piezometer at 80 m in Isère: what the theory doesn’t tell you
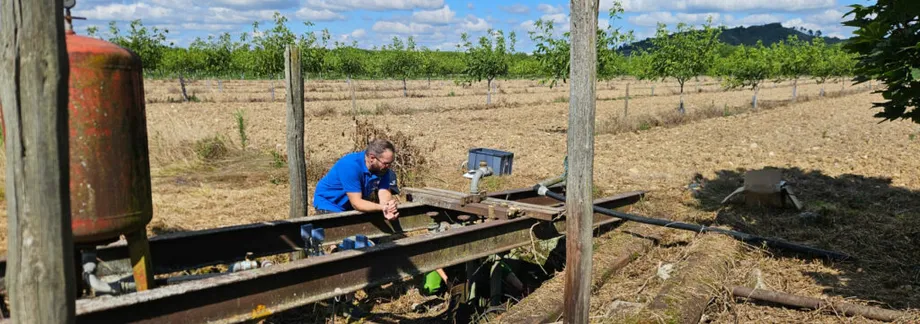
We met this partner from Isère — ADI 38 — at the SIVAL 2025 trade fair, and they asked us to install our connected piezometer in an 80 m deep borehole. Like all our sensors, the solution comes with no subscription, low-cost and low-tech. The FURGO team travelled on site to assist with the installation. And in the field, things rarely go the way they do on the diagram.
Why monitor this water table
In this part of Isère, the hydrographic network is complex: water moves between several water-table systems. In a farming region, saving water and optimising irrigation are challenges shared by local authorities and farmers. The aim is to characterise the impact of abstraction on the water-table level and to follow how it changes over time, to feed the discussions between the parties.
What you picture from the office
On paper, installing a piezometer is simple: pay out cable until the probe touches the water. That idea came from a previous experience at Arvalis/INRAE, where the water table was very close by in the pumping station. The problem with our diagrams: they are not to scale. On site, you grasp what an 80 m borehole really means, with water expected at 65 m.
The reality of the borehole
First observation: the tube is not straight. The deeper a borehole, the harder it is to drill it straight. Then, the tube is already cluttered with cables, pump hoses and tangled wires that obstruct the descent. As a result, the probe slides along the wall, jams against a hose, and it becomes hard to tell when it actually touches the water — without the tell-tale “plop” we had imagined.
To find the water, a hydrogeologist used a sounding tape that beeps on contact with the water. Not without risk to the equipment: it stayed stuck for a good twenty minutes. The depth obtained, however approximate, made it possible to place the marks on the cable. After that, deployment is essentially a matter of paying out cable, while ensuring venting to the atmosphere along the entire length.
First data of the season
Analysis of the readings shows abstraction slowing down around 19 and 29 August, then the level rising again and stabilising in early September. These dates match rainfall events, confirmed by the observation archives of Météociel.
Next steps: regular checks with the hydrogeologist to make sure the reading does not drift (membrane deformation), recalibration if needed, and field feedback to improve the product. Sensor details are on the water-table monitoring piezometer page.
Going further: Capacitive probe with no subscription — the full page with hardware, prices and real cases.